These materials are for informational purposes only and do not constitute legal advice. You should contact an attorney to obtain advice with respect to the development of a research app and any applicable laws.
Charts and Graphs
The ResearchKit framework provides classes that display data in charts and graphs. Presenting information this way helps users understand your data better and provides key insights in a visual way.
Use the ResearchKit classes to create five kinds of charts:
- Pie chart (ORKPieChartView). A pie chart is a circular chart divided into segments, which is useful for showing the magnitude of a particular data point as it relates to the whole. For example, a task-based research app could use a pie chart to display how many of the user’s daily activities are complete.
- Line graph (ORKLineGraphChartView). A line graph is a type of chart that displays information as a series of data points connected by a straight line. Use a line graph to display the number of steps taken by a user every day in a week.
- Multiple line graph. A multiple line graph is a type of line graph that’s useful for comparing multiple data sets over time.
- Discrete graph (ORKDiscreteGraphChartView). A discrete graph displays information as a series of data points in which each series is evenly spaced across the axis according to a tier row index. A discrete graph chart is a good choice for displaying data within a range, such as the range of a user’s heart rate over the past month.
- Discrete graph with multiple points. A discrete graph with multiple points groups together noncontinuous values, which is useful for showing relationships between different types of discrete values that occur at the same time (e.g. viewing a user’s blood pressure and heart rate in a single discrete graph).
Each of these charts is shown in Figure 1.
 Pie Chart
 Line graph chart
 Line graph chart with multiple lines
 Discrete graph chart
 Discrete graph chart with multiple points
Add a Chart to Your App
Chart objects adhere to the Model-View-Controller (MVC) paradigm. MVC emphasizes separation between the data (model), the presentation of that data (view), and the class required to coordinate the data and its view (controller). This design pattern is pervasive in iOS programming and is an integral part of the charts feature.
In a research app, the chart object (view) must be connected to a data source object (model) which is responsible for supplying the data. The chart is then presented to a view controller object (controller) which establishes the necessary connections between the data source and the view.
To add a chart or graph to your app, first create a data source class to supply the data. Next, create a chart or graph object (such as an ORKPieChartView object), connect it to the data source, customize the chart object as you want, and present it in a view controller.
Implement the Data Source Protocol
The data source provides the information that a chart object needs in order to construct a chart. This communication is enforced by a contractual obligation between objects known as a protocol. A protocol is composed of a name and a list of methods that the data source promises to implement.
Two types of methods exist in a protocol: required and optional methods. You must implement the required methods in the data source while choosing which optional methods to implement. In the case of ResearchKit charts, one of the required methods of the protocol provides the number of points (or segments) and another required method provides the value of each point to the chart object. The optional methods of the protocol help in further configuring data, such as color of the x axis or segments.
When providing the data to a chart, the data source must adopt one of two protocols: the ORKGraphChartViewDataSource protocol (for a graph chart) or the ORKPieChartViewDataSource protocol (for a pie chart). For specific examples of implementing these protocols, see Adding a Line or Discrete Graph Chart to Your App and Adding a Pie Chart to Your App.
Create a Chart Object and Adding It to a View Controller
To present data in a chart, create an instance of a ResearchKit chart object, such as ORKPieChartView or ORKLineGraphChartView. To do this, first create a UIView object in a UIViewController object and change the custom class of the view to the ResearchKit chart class you want to use.
Next, use an IBOutlet to link the chart view to your code. This connection between your code and the view will allow you to update the contents of the chart on demand, as well as customize its look and feel.
Then, connect the chart view with your data source so that the chart has access to the data. For example, to connect a pie chart object with a custom data source, you can use code similar to this:
    // Connect the pie chart-view object to a data source
    pieChartView.dataSource = pieChartDataSource
Customize the Chart Object (Optional)
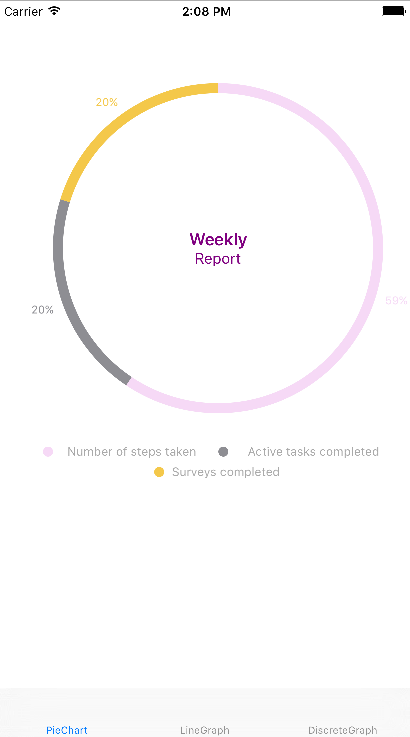
Although the default ResearchKit charts and graphs are ready to use with your data, it’s easy to customize them to suit your app. Each chart object includes several properties that let you customize its look and feel. You can title the segments in a pie chart by implementing the titleForSegmentAtIndex method in a pie chart data source class, as shown here:
  func pieChartView(pieChartView: ORKPieChartView, titleForSegmentAtIndex index: Int) -> String {
    switch index {
    case 0:
        return "Steps taken"
    case 1:
        return "Tasks completed"
    case 2:
        return "Surveys completed"
    default:
        return "task \(index + 1)"
    }
}
The code above displays the titles in the pie chart shown in Figure 2.
To learn about the customizable properties of pie, line graph, and discrete graph chart objects, see ORKPieChartView, ORKGraphChartView, and ORKDiscreteGraphChartView.
Add a Pie Chart to Your App
The data source object that provides data to a pie chart adopts the ORKPieChartViewDataSource protocol. To construct a pie chart, you need to know the number of segments and the value of each segment.
To specify the number of segments in a pie chart, implement the numberOfSegmentsInPieChartView method and return an integer that indicates the number of segments in the pie chart. This code specifies a pie chart that has three segments:
func numberOfSegmentsInPieChartView(pieChartView: ORKPieChartView) -> Int {
    return 3
}
Before you can draw the segments in a pie chart, you need to specify the value of each segment. To provide a value for each segment of the pie chart, implement the valueForSegmentAtIndex method.
The values themselves are percentages whose sum should equal to 100.0. For example, the code below returns the values 50, 30, and 20 for segments at indexes 0, 1, and 2 in the pie chart:
func pieChartView(pieChartView: ORKPieChartView, valueForSegmentAtIndex index: Int) -> CGFloat {
    switch index {
    case 0:
        return 60.0
    case 1:
        return 25.0
    case 2:
        return 15.0
    }
}
You can use the optional methods in the pie chart data source protocol to help you customize the look and feel of the data in the chart, including specifying a color and a title for each segment. (To learn more about using properties in the pie chart data source protocol to customize your chart, see ORKPieChartViewDataSource.)
Here’s an example of a pie chart data source class that includes both required and optional methods:
class PieChartDataSource: NSObject, ORKPieChartViewDataSource {
    // Specify three different colors.
    let colors = [
        UIColor(red: 217/225, green: 217/255, blue: 217/225, alpha: 1),
        UIColor(red: 142/255, green: 142/255, blue: 147/255, alpha: 1),
        UIColor(red: 244/255, green: 200/255, blue: 74/255, alpha: 1)
    ]

    // Values for each of the three segments.
    let values = [60.0, 25.0, 15.0]

    // Required methods.
    func numberOfSegmentsInPieChartView(pieChartView: ORKPieChartView ) -> Int {
        return colors.count
    }

    func pieChartView(pieChartView: ORKPieChartView, valueForSegmentAtIndex index: Int) -> CGFloat {
        return CGFloat(values[index])
    }

    // Optional methods
    // Give a color to each segment in the pie chart.
    func pieChartView(pieChartView: ORKPieChartView, colorForSegmentAtIndex index: Int) -> UIColor {
        return colors[index]
    }

    // Give a title to each segment in the pie chart.
    func pieChartView(pieChartView: ORKPieChartView, titleForSegmentAtIndex index: Int) -> String {
        switch index {
        case 0:
            return "Steps taken"
        case 1:
            return "Tasks completed"
        case 2:
            return "Surveys completed"
        default:
            return "task \(index + 1)"
        }
    }
}
After you create a pie chart data source class, create a pie chart object that presents the data it receives from the data source object. This code shows how to create a pie chart object, connect it to the data source, and customize some of its properties:
// Create a pie chart object
@IBOutlet weak var pieChartView: ORKPieChartView!
override func viewDidLoad() {
super.viewDidLoad()
// Connect the pie chart object to a data source
pieChartView.dataSource = pieChartDataSource
// Optional custom configuration
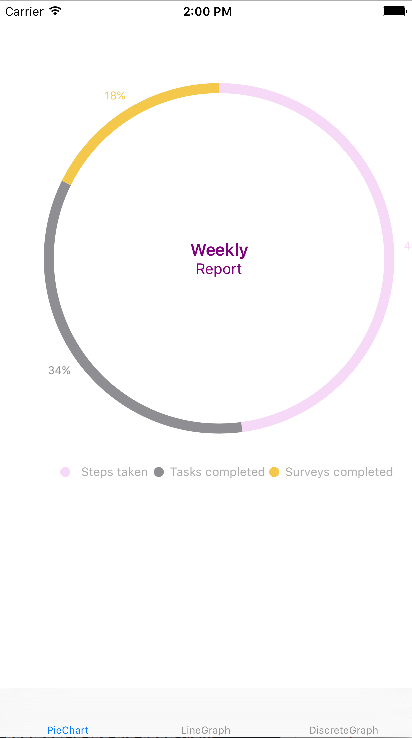
pieChartView.showsTitleAboveChart = false
pieChartView.showsPercentageLabels = true
pieChartView.drawsClockwise = true
pieChartView.titleColor = UIColor.purpleColor()
pieChartView.textColor = UIColor.purpleColor()
pieChartView.title = "Weekly"
pieChartView.text = "Report"
pieChartView.lineWidth = 10
pieChartView.showsPercentageLabels = true
}
Figure 3 shows the pie chart created by the code in this section.

Add a Line or Discrete Graph Chart to Your App
Adding data to line and discrete graph is a matter of implementing methods in the ORKGraphChartViewDataSource protocol. There are several methods that you must implement for correct behavior.
Line and discrete graphs can display one or more plots. A plot is a graphical representation of a relationship between two variables.
Start by implementing the graphChartView:numberOfPointsForPlotIndex: method. Here, you return the number of points for the specific plot index (a graph may have more than one plot associated with it).
Next, implement the graphChartView:pointForPointIndex:plotIndex: method. In this method, return a ORKValueRange (which represents a ranged point used in a graph plot) for the given point index and plot index.
An optional method that you can implement is numberOfPlotsInGraphChartView:. Here, return the number of plots for the passed graph. If you don’t implement this method, one plot is assumed.
Other optional methods provide titles as well as set minimum and maximum values for the y axis.
Here’s an example of a data source class for a line graph. This class returns five points for the two plots that will appear on the graph:
class LineGraphDataSource: NSObject, ORKGraphChartViewDataSource {

var plotPoints =
[
    [
        ORKValueRange(value: 200),
        ORKValueRange(value: 450),
        ORKValueRange(value: 500),
        ORKValueRange(value: 250),
        ORKValueRange(value: 300),
        ORKValueRange(value: 600),
        ORKValueRange(value: 300),
    ],
    [
        ORKValueRange(value: 100),
        ORKValueRange(value: 350),
        ORKValueRange(value: 400),
        ORKValueRange(value: 150),
        ORKValueRange(value: 200),
        ORKValueRange(value: 500),
        ORKValueRange(value: 400),
    ]
]

// Required methods

func graphChartView(graphChartView: ORKGraphChartView, pointForPointIndex dataPointForPointIndex: Int, plotIndex: Int) -> ORKValueRange {

    return plotPoints[plotIndex][pointIndex]
}

func graphChartView(graphChartView: ORKGraphChartView, numberOfDataPointsForPlotIndex plotIndex: Int) -> Int {
    return plotPoints[plotIndex].count
}

// Optional methods

// Returns the number of points to the graph chart view
func numberOfPlotsInGraphChartView(in graphChartView: ORKGraphChartView) -> Int {
    return plotPoints.count
}

// Sets the maximum value on the y axis
func maximumValueForGraphChartView(for graphChartView: ORKGraphChartView) -> CGFloat {
    return 1000
}

// Sets the minimum value on the y axis
func minimumValueForGraphChartView(for graphChartView: ORKGraphChartView) -> CGFloat {
    return 0
}

// Provides titles for x axis
func graphChartView(_ graphChartView: ORKGraphChartView, titleForXAxisAtPointIndex pointIndex: Int) -> String? {
    switch pointIndex {
    case 0:
        return "Mon"
    case 1:
        return "Tue"
    case 2:
        return "Wed"
    case 3:
        return "Thu"
    case 4:
        return "Fri"
    case 5:
        return "Sat"
    case 6:
        return "Sun"
    default:
        return "Day \(pointIndex + 1)"
    }
}

// Returns the color for the given plot index
func graphChartView(graphChartView: ORKGraphChartView, colorForPlotIndex plotIndex: Int) -> UIColor {
    if plotIndex == 0 {
        return UIColor.purpleColor()
    }
}
Note: A discrete graph uses the same data source protocol as a line graph, so the data source class for a discrete graph tends to look similar to the line graph data source class shown above.
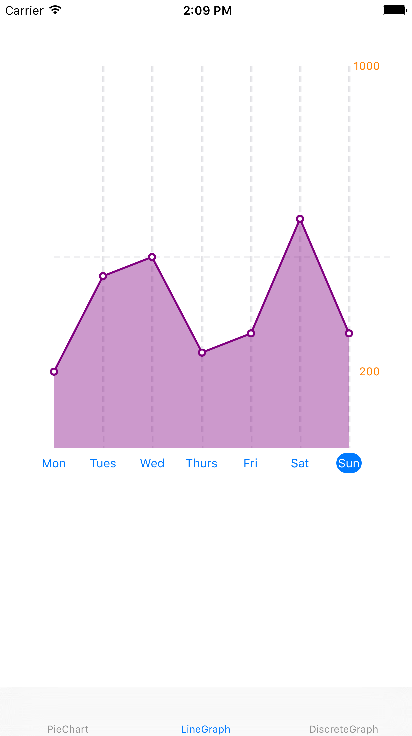
After you create the data source class for a graph, create a graph chart object to present the data. This code creates a line graph chart object, connects it to the data source shown above, and customizes some of its properties:
// Create a line graph view object
@IBOutlet weak var lineGraphView: ORKLineGraphChartView!
override func viewDidLoad() {
super.viewDidLoad()
// Connect the line graph view object to a data source
lineGraphView.dataSource = lineGraphChartDataSource()
// Optional custom configuration
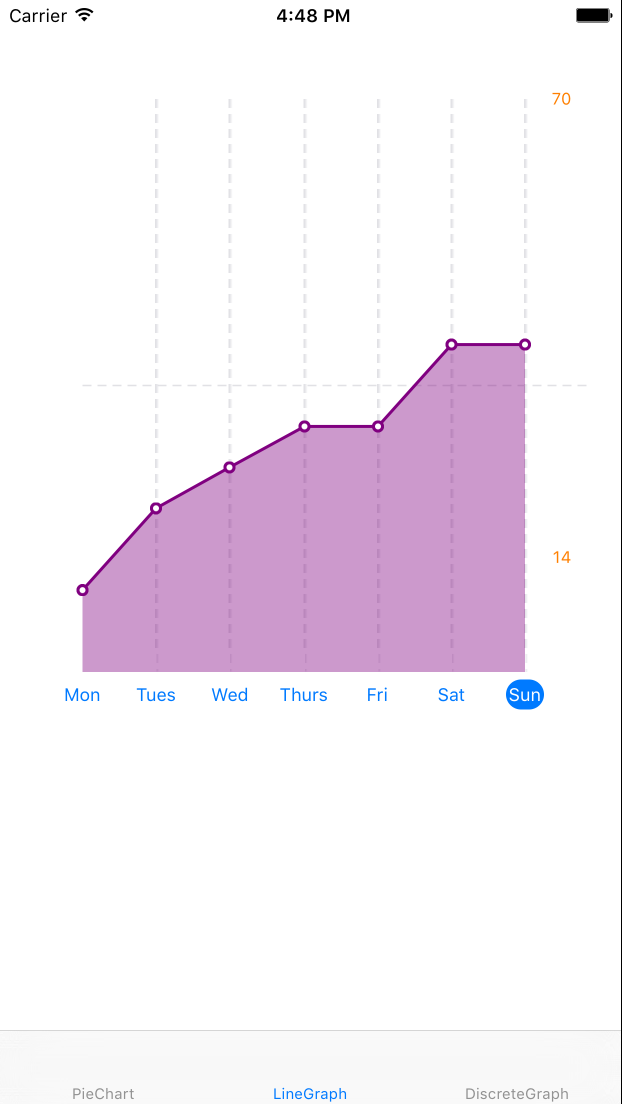
lineGraphView.showsHorizontalReferenceLines = true
lineGraphView.showsVerticalReferenceLines = true
lineGraphView.axisColor = UIColor.whiteColor()
lineGraphView.verticalAxisTitleColor = UIColor.orangeColor()
lineGraphView.showsHorizontalReferenceLines = true
lineGraphView.showsVerticalReferenceLines = true
lineGraphView.scrubberLineColor = UIColor.redColor()
}
Figure 4 shows the line graph created by the code in this section.
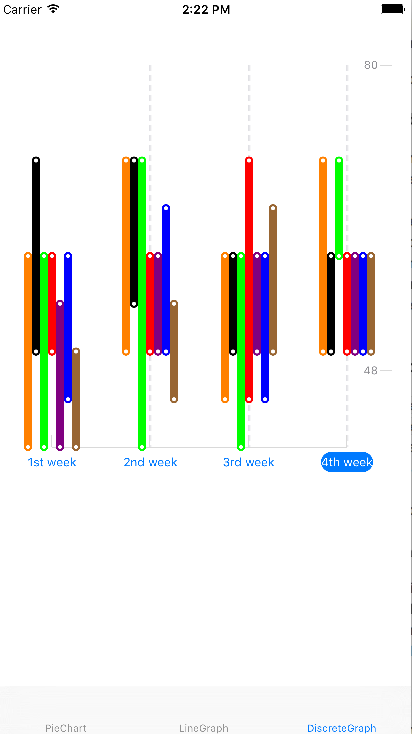
To display a discrete graph chart instead of a line graph chart, use code similar to the code below to create a discrete graph chart object, connect it to a data source, and customize some of its properties:
// Creating discrete graph chart-view object
@IBOutlet weak var discreteGraphChart: ORKDiscreteGraphChartView!
//Connecting discrete graph chart-view object to a data source
let discreteGraphChartDataSource = DiscreteGraphDataSource()
override func viewDidLoad() {
super.viewDidLoad()
// Connect the line graph view object to a data source
discreteGraphChart.dataSource = discreteGraphChartDataSource
// Optional custom configuration
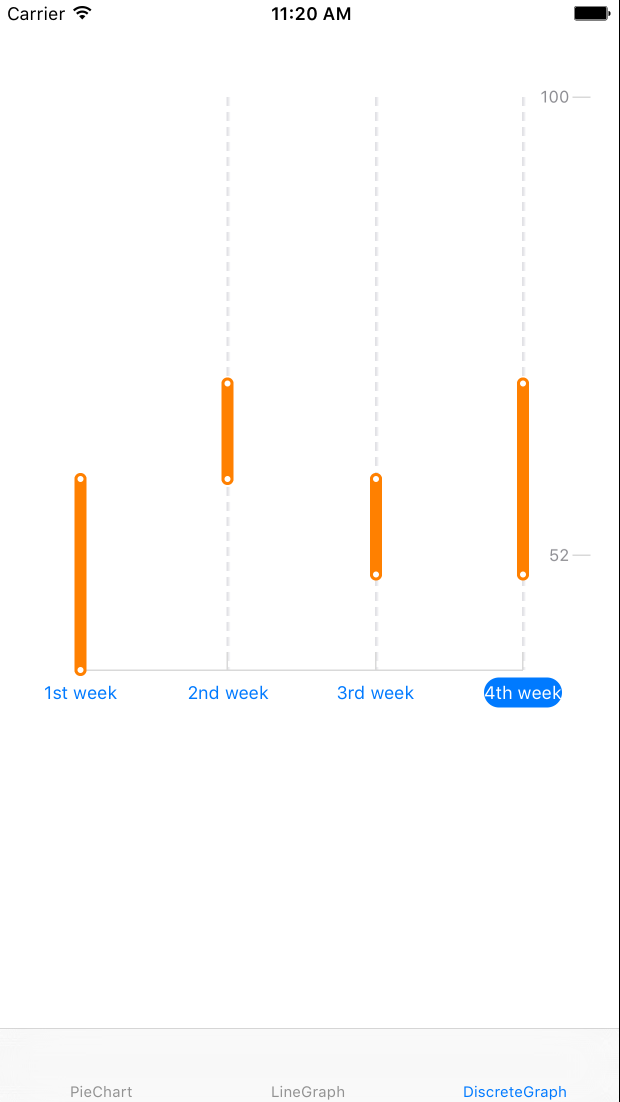
discreteGraphChart.showsVerticalReferenceLines = true
discreteGraphChart.drawsConnectedRanges = true
}
Figure 5 shows a discrete graph that uses the same data source class created for the line graph chart at the beginning of this section.
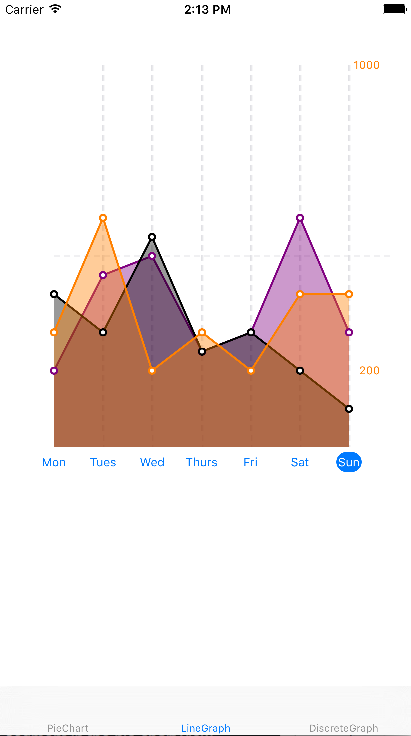
Draw Multiple Lines in a Graph
By default, the graph object assumes that it has a single plot to draw. To draw more than one plot on a graph, use the numberOfPlotsInGraphChartView method and specify the number of plots in the graph. This optional data source method is useful when drawing more than one plot on a graph chart.
This code shows how a graph object can draw two plots:
 // Optional methods
func numberOfPlotsInGraphChartView(graphChartView: ORKGraphChartView) -> Int {
    return 2
}
Add Titles to a Graph Chart
To add titles along the x axis in a line or discrete graph, implement the titleForXAxisAtPointIndex method in the data source class and return the title to display adjacent to each division on the x axis. For the y axis, display maximum or minimum values using the maximumValueForGraphChartView: or minimumValueForGraphChartView: properties (to display images instead of values, use the maximumValueImage and minimumValueImage properties).
The following code displays titles on the x axis of a discrete graph chart:
 func graphChartView(graphChartView: ORKGraphChartView, titleForXAxisAtPointIndex pointIndex: Int) -> String? {
    switch pointIndex {
    case 0:
        return "Jan"
    case 1:
        return "Feb"
    case 2:
        return "Mar"
    case 3:
        return "Apr"
    default:
        return "Month \(pointIndex + 1)"
    }
}
The code above displays the titles you can see in the discrete graph shown in Figure 6.

Support the Pan Gesture
By default, the graph chart object implements the pan gesture for you. When the user drags a finger along the graph in a view, a label appears above the point that’s closest to the user’s finger, displaying the point’s value.
You can extend the default pan gesture behavior by implementing the ORKGraphChartViewDelegate protocol. The graph chart view delegate protocol forwards the pan gesture events occurring within the bounds of an ORKGraphChartView object.
There are three optional methods that can be implemented:
graphChartViewTouchesBegan:alerts the object when the user has started touching the graph chart view.graphChartView:touchesMovedToXPosition:provides the position on the x axis where the touch has moved.graphChartViewTouchesEnded:alerts the object when the user has stopped touching the graph view.
Update the Data Source
In the examples above, the plotPoints are hard-coded. To update the data source, you may add functions that take in a new set of plotPoints to update the data. Call the reloadData() method after updating your data source in order to redraw the graph.
If your graph is in a table view:
override func viewWillAppear(_ animated: Bool) {
    super.viewWillAppear(animated)
    let dataSource = lineGraphChartView.dataSource as! yourDataSource
    dataSource.updatePlotPoints(newPlotPoints: [
    ORKValueRange(value: 2),
        ORKValueRange(value: 4),
    ORKValueRange(value: 8),
    ORKValueRange(value: 16),
    ORKValueRange(value: 32),
    ORKValueRange(value: 64),
    ]
    hrLineGraphChartView.reloadData()
    hrLineGraphChartView.animate(withDuration: 0.5)
}